Dashboard Extensions
Features
Categories
All Dashboard Extensions
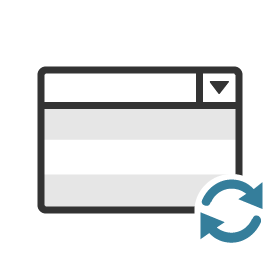
Export All
by The Information Lab
Use Export All to generate a single Excel workbook from multiple Tableau charts.
ShowMeMore 2.0
by Infotopics | Apps for Tableau
Add new visualization types like the Sankey Diagram and Radar Chart to your Tableau Dashboards.
Button Filter
by Biztory
Replace any single or multiple value quick filter by a series of clickable buttons.

Filter Bookmarks
by Tableau
Instantly revert your dashboard filters to predefined settings.
Data-Driven Parameters
by Tableau
Automatically update your parameters based on your data!
Dynamic Date Range Filter
by Biztory
Set a date range filter to a default range when launching a dashboard.
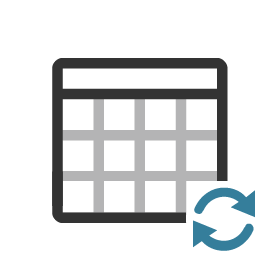
SuperTables
by Infotopics | Apps for Tableau
Let users analyze and discover the data to support your visuals in stunning interactive tables.
Single Checkbox Parameters
by Tableau
This extension allows you to have a single checkbox that can toggle between two values.
DataTables
by Tableau Magic
The internet standard for creating Tables is now available in Tableau.
Date Updater
by Tableau
Automatically update your date parameters to today, yesterday, a week ago or a month ago.
DrillDownTree
by Infotopics | Apps for Tableau
Visualize and aggregate data across multiple dimensions - drill down in any order.
Date Range Picker
by BackSpace
Offer your users an intuitive function to select a date range in your dashboards within seconds.
Image Viewer
by The Information Lab
Display one or more images on your dashboard driven by either select or filter actions.
Dynamic Date Parameter
by Biztory
Set a date parameter to a default value when launching a dashboard.

HierarchyFilter
by Infotopics | Apps for Tableau
Visualize flat or recursive data into a beautiful hierarchy filter.
Bar Race
by Inovista
A bar chart that resizes and relocates bars as they animate through a time period.
PowerKPIs
by Infotopics | Apps for Tableau
Integrate strategic insights into your Tableau dashboards with PowerKPIs
Quick What-If
by Tableau
A quick way to do what-if analysis on separate members of a dimension.
Image Map Filter
by Tableau
Create a more interactive experience with a custom image map to filter your dashboards.
Kepler.gl
by Vis.gl
A high-performance WebGl based tool for visual exploration of large-scale geospatial data sets.
Image Filter
by Biztory
Replace any single or multiple value quick filter by a series of clickable images.
Parameter Actions
by Tableau
Update parameters based on worksheet selections! Now also a built-in feature of 2019.2!
Semiotic Hierarchy
by Starschema
Leverage the brilliance of the Semiotic hierarchy chart library, directly within Tableau!
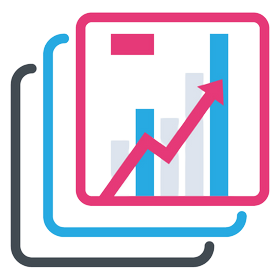
Add-On Charts
by Solbeg
Use our charts to see your numbers in a new way.
Let's Annotate
by Starschema
Custom annotations for your Tableau Dashboards. Leverages React Annotation.
ProcessMining
by Infotopics | Apps for Tableau
Visualize and analyze your processes based on log file extractions
graphomate matrix
by graphomate GmbH
Create meaningful tables with no limits and easy implementation of company standards.
graphomate pictograms
by graphomate GmbH
These pictograms serve the simplified graphical representation by symbols and icons in bar charts.

graphomate charts
by graphomate GmbH
graphomate charts enable customers to design IBCS compliant charts and more within a few clicks.
Animated Bubbles
by Inovista
This chart presents animated bubbles or images which resize and relocate as the data values progress through time.
Brush Filter
by Starschema
Provides interactive data filtering with brushing. (region specification with mouse gestures).
Eqolines
by zsah
Analyse the world the way we use it, not straight lines
Trellis Chart Auto Resize
by Mark Jackson
Automatically change the size of a trellis chart based on the viewable area.
graphomate bubbles
by graphomate GmbH
Meaningful portfolio analyses with up to 5 key figures and almost unlimited formatting options.